February 24, 2020
The Oscilloscope
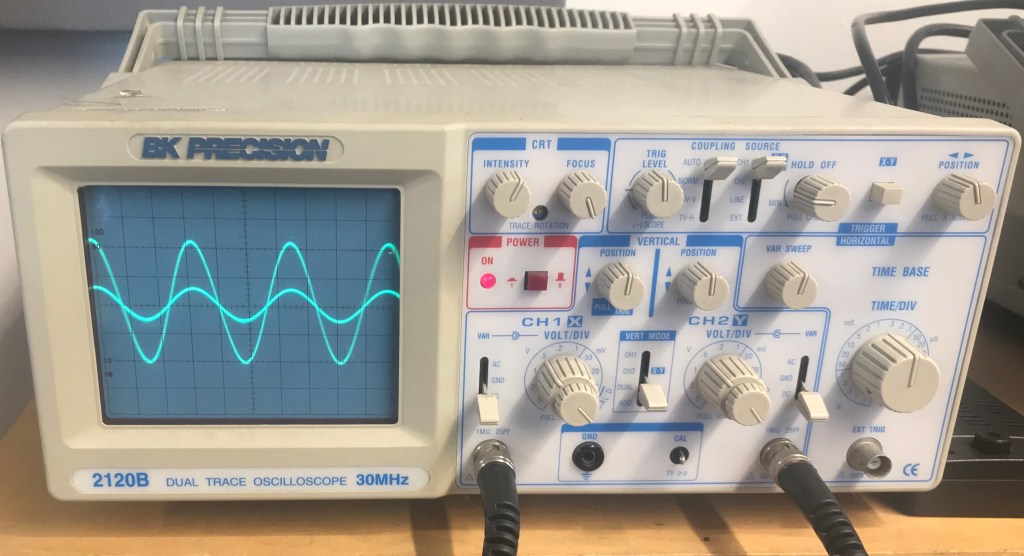
An oscilloscope graphs Voltage over time. To make it work correctly certain controls must be on. Find the power button and turn it on (it might take a few seconds to fully turn on). Then flip the “vert mode” switch to Ch.1 to only see that channel. Make the under “CH.1” that the Volt/div knob is at .5 and the inner dial is as far clockwise as possible (you will hear a click when it is at the correct position). Set the var switch under channel 1 to ground so that all you see is a horizontal line. This will allow you to easily adjust the vertical height. Using the vertical position knob for channel one, adjust the position so that the line is on the x-axis (if you can’t see the line, check to make sure that the position isn’t turned all the way in one direction or the other). Finally, once you’re done adjusting, switch “Var” from ground to DC. Switch the “Vert Mode” to “CH2” and repeat the same thing for channel 2. Under “Horizontal” turn the “Tine/Div” knob to .5 so that you will be able to see the waveform clearly. Then Make sure the Coupling switch is set to TV-V or Auto. Connect your circuit to channel 1 and channel two and change the “Vert. Mode” to “dual” to see both channels.
Volts/Div and Time/Div
The X and Y axis represent time and voltage respectively. By changing the volts per div the amount of the signal that is seen changes. The volts per div changes the number of volts that are seen in each of the blocks in the grid. The time per div determines how much time each of the little blocks is on the grid (scale of the grid). By changing this you also change how much of the signal you see.
The Trigger Controls
The trigger controls allow you to change what you see. There is a control, “Vert Mode”, to change between seeing ch.1, ch.2, and duel. When adjusting channels individually set this to channel one or two and when looking at the waveforms together, set it to dual. Use the position trigger knob to adjust where the wave is on the screen. You want to have this set in the middle so you are able to see a clear unmoving waveform. And finally, you will use one to set the trigger mode to set it to TV-V or auto so the oscillator can determine how to display the voltage.
More Information
- Make sure to trace your connections so you are sure you have the correct input on the oscilloscope and know what you’re looking at.
- Always connect the red probe to the input and the black probe to ground.
- Make sure your volume is all the way up on your computer (or whatever divide you are using to create the sin wave)
The Potentiometer
When the pot is turned all the way to zero there is zero resistance so the oscillator will show a maximum amplitude of the voltage (Y-axis). This shows up on the oscilloscope as a full waveform. However, as you turn the pot in the opposite direction the resistance increases and the output becomes less and less. This appears as a straight line on the oscilloscope. The minimum amplitude of the output wave as a percentage of the input wave is 0% when the resistance is increased fully and the wave appears as a horizontal line. The maximum amplitude is 100% when there is zero resistance and the output and input waves match.
Videos
Troubleshooting
Troubleshooting notes found HERE

